Sample claim headline goes here.
Measured ResultOne-sentence plain-language explanation of what this claim means in practice.
The Indian River Lagoon has not fully recovered. That is not a reason to hide disappointing outcomes or accept weak accountability. It is a reason to improve the work while preserving the capacity to keep doing it. The decision before voters is whether to continue a dedicated restoration funding mechanism — or interrupt it without an approved replacement plan.
This is a continuation decision, not a blank-sheet referendum. Voters should understand what the existing mechanism funds, what safeguards apply, what has and has not been achieved, and what happens if the renewal is rejected.
The Save Our Indian River Lagoon Sales Tax will be provided on the November 2026 Ballot for the citizens of Brevard County to vote on renewing the initiative. The ballot language will read as follows:
To restore the Indian River Lagoon through infrastructure, capital improvements, capital maintenance projects and programs designed to improve water quality and fish and wildlife habitat, remove muck, and reduce pollution, shall Brevard County renew the existing Save Our Indian River Lagoon half-cent sales tax for ten years, and require deposit of all revenue to a trust fund solely for such purposes, with continued citizen committee oversight and annual independent audits?
Polls open 7 AM to 7 PM. If you are in line at 7 PM, you may still vote.
votebrevard.gov →Registration books close 29 days before the election. Check your status or register online.
Register or check status →The Supervisor of Elections must receive your request by 5 PM on the 12th day before the election.
Request a mail ballot →Any registered Brevard voter may vote at any designated early-voting site during this 13-day window.
Early-voting sites →Look up your assigned precinct before Nov 3. Polling locations can change; verify a week ahead.
Look up polling location →The Brevard Supervisor of Elections publishes the sample ballot for each election, including this referendum.
Current election information →Clean water is not only an environmental issue. It touches nearly every part of daily life in Brevard.
Continues the dedicated restoration funding mechanism while leaving room — and creating an obligation — to improve how projects are selected, measured, verified, and reported.
It does not mean every past decision was correct. It means reform and accountability can proceed without first dismantling the principal dedicated funding stream.
Rejects the renewal. It does not, by itself, establish a replacement plan, create a new funding source, preserve project continuity, or guarantee that a more comprehensive program will appear.
A NO vote may express dissatisfaction, but dissatisfaction alone does not finance wastewater work, septic conversions, stormwater projects, muck removal, habitat work, monitoring, or long-term maintenance.
The lagoon has not yet achieved lagoon-wide ecological recovery. That fact should not be hidden or softened. It also does not mean that wastewater upgrades, septic conversions, stormwater projects, muck removal, monitoring, and habitat work are meaningless. The public deserves to see the difference between work completed, pollution prevented or removed, localized environmental response, and actual lagoon-wide recovery.
A credible public record must show both progress and underperformance. It must identify which projects were completed, which were delayed, what reductions were modeled, what was directly measured, what ecological response occurred, and where the evidence remains uncertain.
Clean-water funding should come with clear rules, public reporting, independent oversight, and results residents can track. LagoonFacts distinguishes money collected from projects completed, modeled pollution reductions from measured reductions, and engineering progress from ecological recovery. Those are not the same thing—and the public deserves to see each one clearly.
Every result on this site should carry one of these plain-language labels so readers can tell what kind of evidence supports it.
Example — evidence card structure (data pending)
One-sentence plain-language explanation of what this claim means in practice.
Restoration progress lives at five different layers. Collapsing all of them into a single “success” number hides which parts are working, which parts are underperforming, and where the evidence is still uncertain. This site reports each layer separately.
Each row shows what a layer of evidence can demonstrate, and what it cannot prove on its own.
| Layer | What to show | What it does not prove by itself |
|---|---|---|
| Funding | Revenue collected, outside funds leveraged, funds obligated, funds spent. | That the work was effective. |
| Delivery | Projects planned, contracted, under construction, completed, delayed, cancelled. | That pollution was reduced as predicted. |
| Intervention | Modeled reductions, measured reductions, uncertainty, verification method. | That the lagoon has recovered. |
| Local response | Water quality, sediment, habitat, seagrass, dissolved oxygen, algal conditions, and site-level indicators. | That the same response occurred lagoon-wide. |
| Lagoon-wide recovery | Long-term ecological trends across representative regions, with limitations disclosed. | Certainty beyond the quality and coverage of the evidence. |
Continued funding should come with clearer ecological benchmarks, transparent project ranking, stronger post-project verification, honest treatment of uncertainty, and public reporting that distinguishes activity from outcomes.
No. Some projects and indicators show progress, but recovery is incomplete and uneven. The honest answer is that parts of the system can improve while other areas remain impaired. LagoonFacts should show both.
Because large restoration programs take years, and the relevant question is not simply whether money was spent. It is what was built, what pollution source was reduced, what was measured, what remains unfunded, and whether the public can track the work.
No. Wastewater, septic, stormwater, dredging, habitat, monitoring, and research projects operate on different timelines. A completed project may reduce a pollution source before seagrass, wildlife, or water quality fully responds.
Every major numeric claim on this site is linked to a primary source (agency report, peer-reviewed paper, audited financial document, or official dataset) and labeled by claim type. Measured results are labeled as measured, modeled estimates are labeled as modeled, and forward-looking projections are labeled as projections. If a figure cannot be independently sourced yet, it is not published as a specific number. Where a claim later turns out to be wrong or outdated, the correction is logged publicly on the corrections page.
No. Wildlife matters, but clean water also affects property, tourism, fishing, boating, public health, insurance exposure, local jobs, community identity, and quality of life.
The practical consequence is that the dedicated local funding stream for lagoon restoration ends, planned revenue and project capacity are delayed or lost, and pollution sources, infrastructure needs, and restoration costs continue in the meantime. Under Florida sales-tax law, a failed local-option renewal typically cannot return to the ballot immediately, so a rejection is not a short-term reset. The exact legal, fiscal, and calendar consequences will be added as they are independently verified against Florida statutes and the Brevard County Supervisor of Elections.
No. LagoonFacts is an independently funded educational and editorial website created and paid for by David Sherrer, a Brevard resident who lived on the lagoon for close to a decade as a lagoon-front homeowner in Cocoa Beach before hurricane flooding damage forced him to sell, and who served on the SOIRL Citizen Oversight Committee. The site is not affiliated with Brevard County, any candidate campaign, or any political committee, and it does not receive government funding. It takes an editorial position in favor of renewing the SOIRL half-cent sales tax. Primary and authoritative source material cited on the site comes from agencies, universities, and research organizations; those sources do not sponsor or endorse LagoonFacts. Full disclosure lives on the About page.
Scientists can disagree about methods, rates, and interpretation while still agreeing on the core observations: excess nitrogen and phosphorus have driven decades of algal blooms, seagrass loss and wildlife mortality followed, and sustained pollution-source reduction plus long-term monitoring is what changes the trajectory. The sources page links to the underlying reports and datasets so the reader can go past authority to the primary evidence.
Clean water supports the regional economy, recreation, jobs, public spaces, community health, and long-term costs carried across the county. The benefit is broader than waterfront property.
Yes. Continued funding should be paired with stronger reporting, clearer metrics, accessible project dashboards, independent review, and correction of claims that no longer match the evidence.
This is a structural preview of the sourced evidence cards that will populate this page as ledger entries clear. Every field below is intentionally held pending verification. No figures have been invented for this shell.
A note on this site's public availability.
IRL Facts is an independently funded editorial and informational site. It uses informational calls to action (“Vote Information,” “Learn About the Referendum,” “See the Science,” “Browse Sources”) and takes an editorial position in favor of renewing the Save Our Indian River Lagoon half-cent sales tax on the November 3, 2026 ballot. That editorial position and independent funding are disclosed in the site footer and on the About page.
The site's ordinary public availability at irlfacts.org is provided as a matter of publishing an editorial and informational resource. Any paid, targeted, boosted, coordinated, or campaign-integrated promotion of this site is a separate workflow, subject to applicable disclaimer, platform advertiser setup, landing-page and privacy review, and a personal spending cap. Ads may expressly advocate YES on the renewal and, when they do, carry the required payer disclaimer.
The lagoon needs honest accounting, stronger measurement, and sustained work. Review the evidence. Examine what was completed, what underperformed, what remains uncertain, and what each ballot choice actually does. Then vote with the lagoon’s long-term future in mind.
Explore the evidenceBelow is the past the lagoon already lived through. Same water. Same shoreline. Same county. Real cameras. Ten years ago.
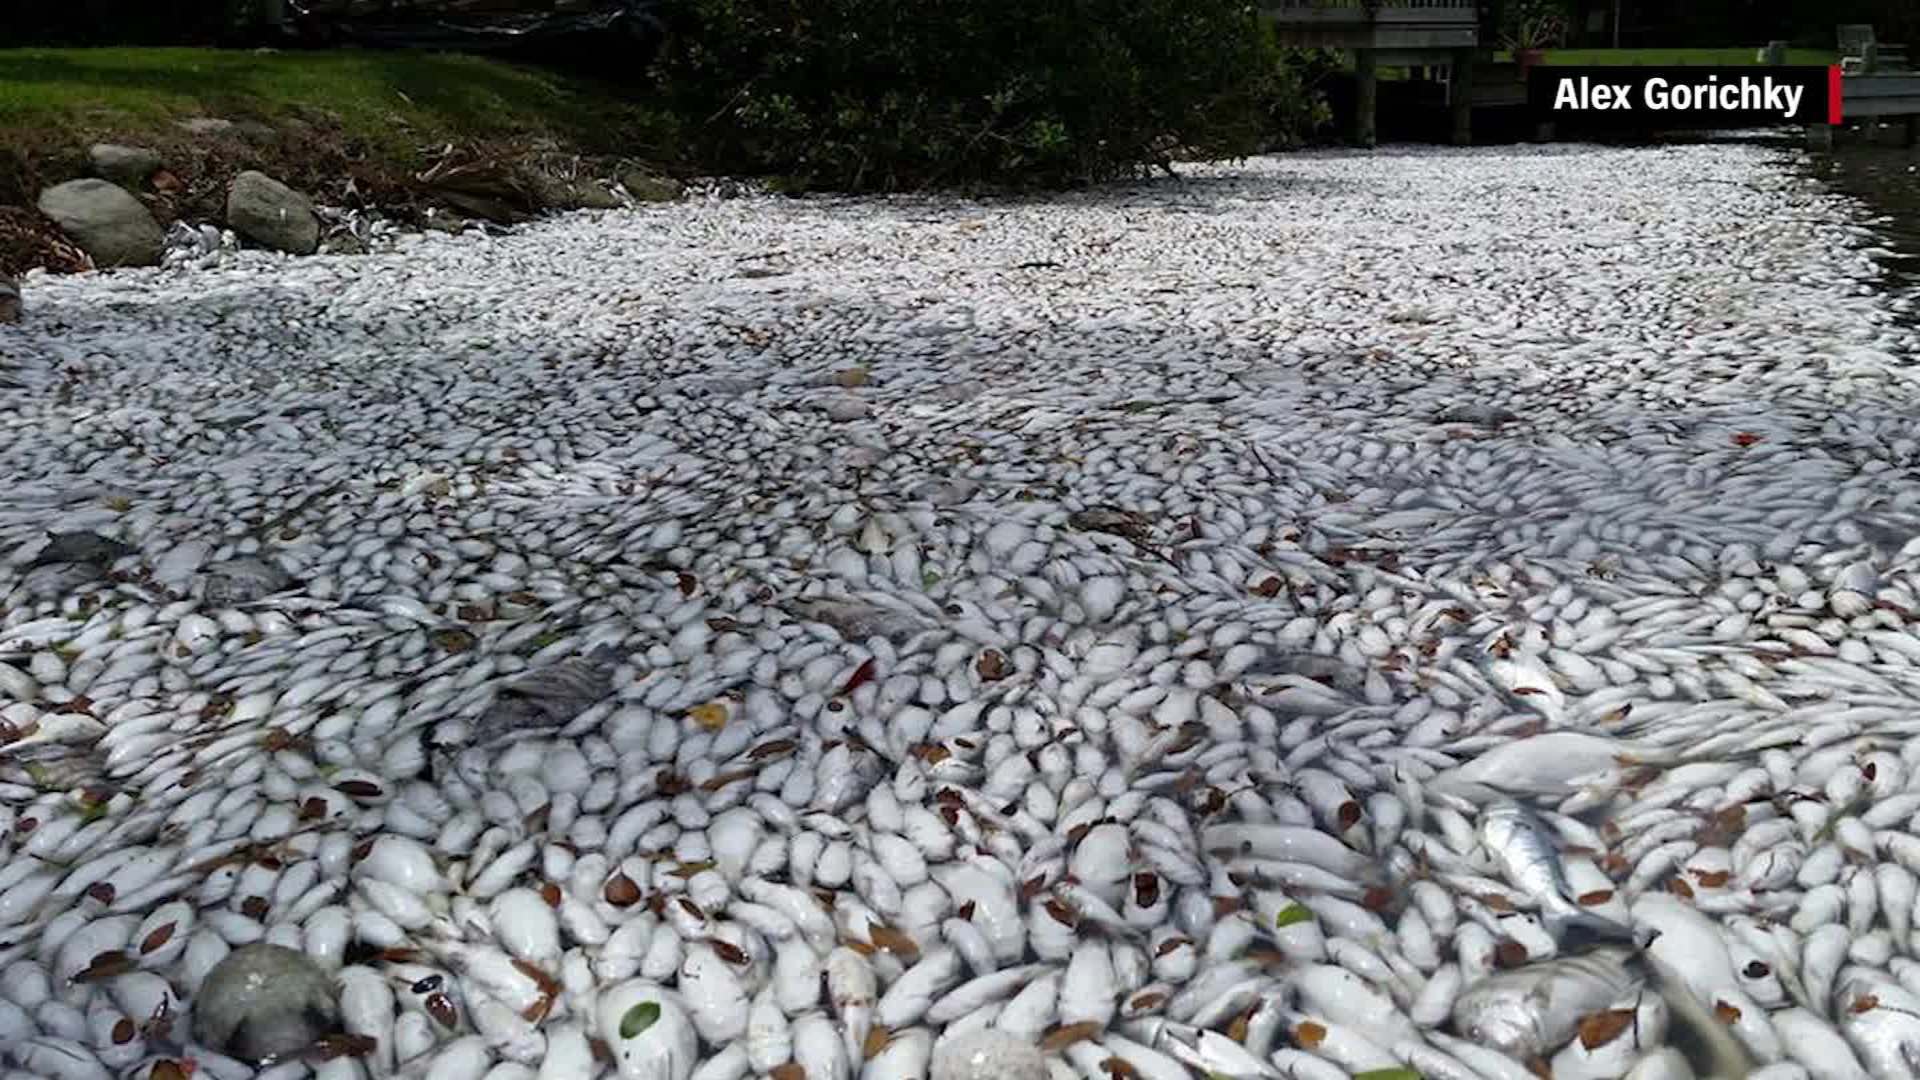
Brown tide algae bloomed all winter on decades of fertilizer, sewage, and septic runoff. When it died in March, bacteria consuming it stripped the oxygen out of the water. Between March 18 and March 20, dissolved oxygen bottomed to zero at 3 AM. Fish across at least 30 species suffocated. Hundreds of thousands of them.
Photo: Alex Gorichky, Local Lines Guide Service, via CNN.
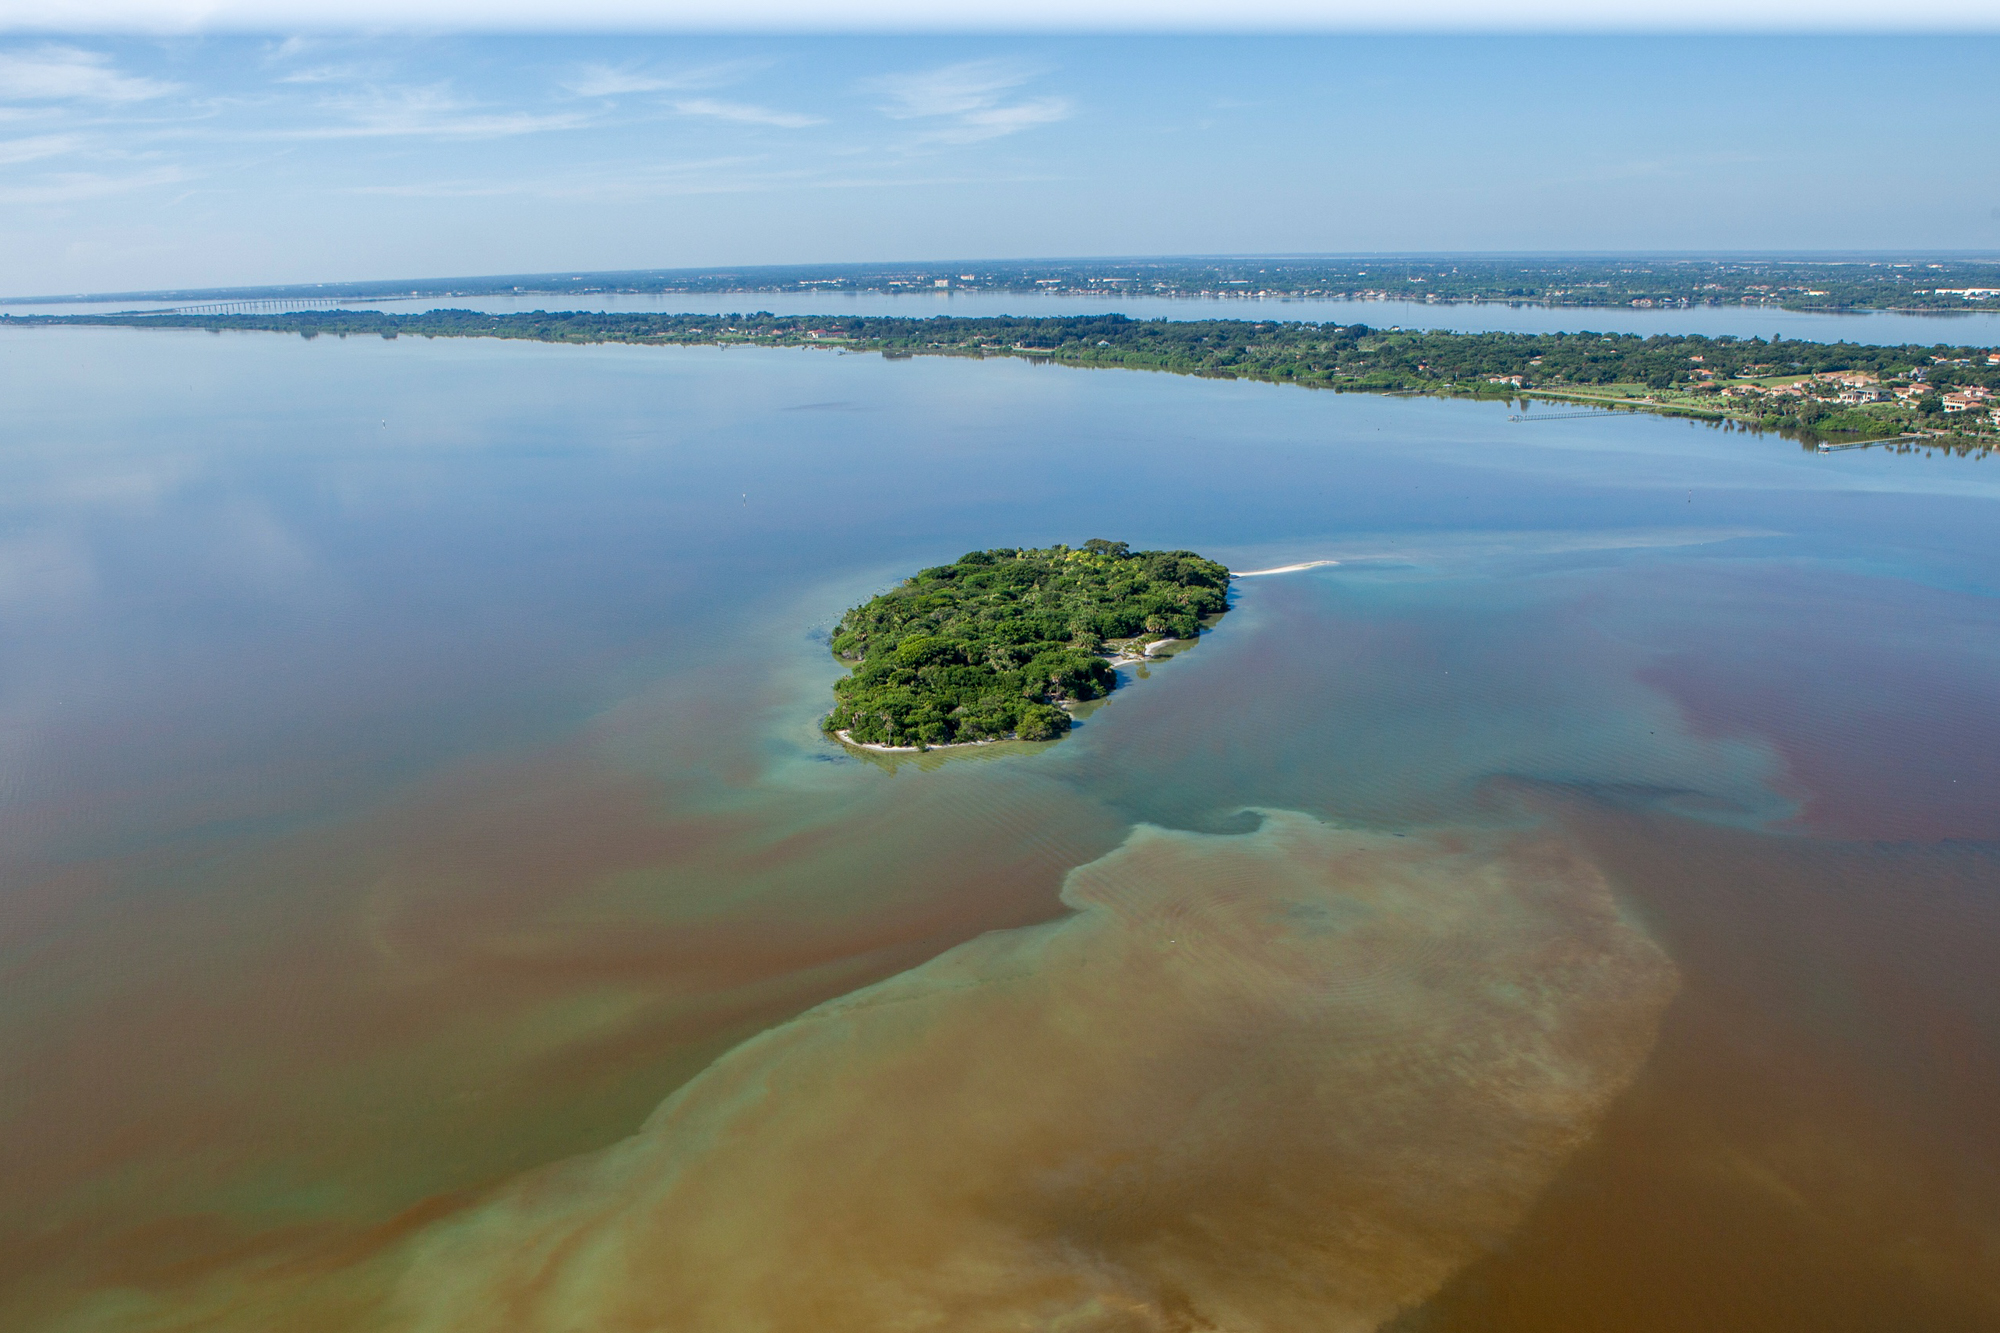
That is Captain Alex Gorichky's quote, verbatim. From above, the collapse was visible for 30 miles. Titusville to Palm Bay. The estuary that draws two million visitors a year, opaque brown, unable to support life below it because sunlight could not reach the seagrass.
Local reporting during the 2016 brown-tide fish kill described dead fish stacked in canals from Titusville to Melbourne, temporary business impacts on waterfront restaurants and boat rental operators, and a lasting smell in shoreline neighborhoods including Snug Harbor, Sykes Creek, Cocoa Beach, and Merritt Island. Cleanup required county-organized dumpsters at five waterfront parks. Source: Florida Today, March 22, 2016.
Fish-kill quantities and cleanup accounts reported at the time by WMFE and Orlando Weekly based on Brevard County cleanup accounts. Manatee mortality data from Florida Fish and Wildlife Conservation Commission Manatee UME record.
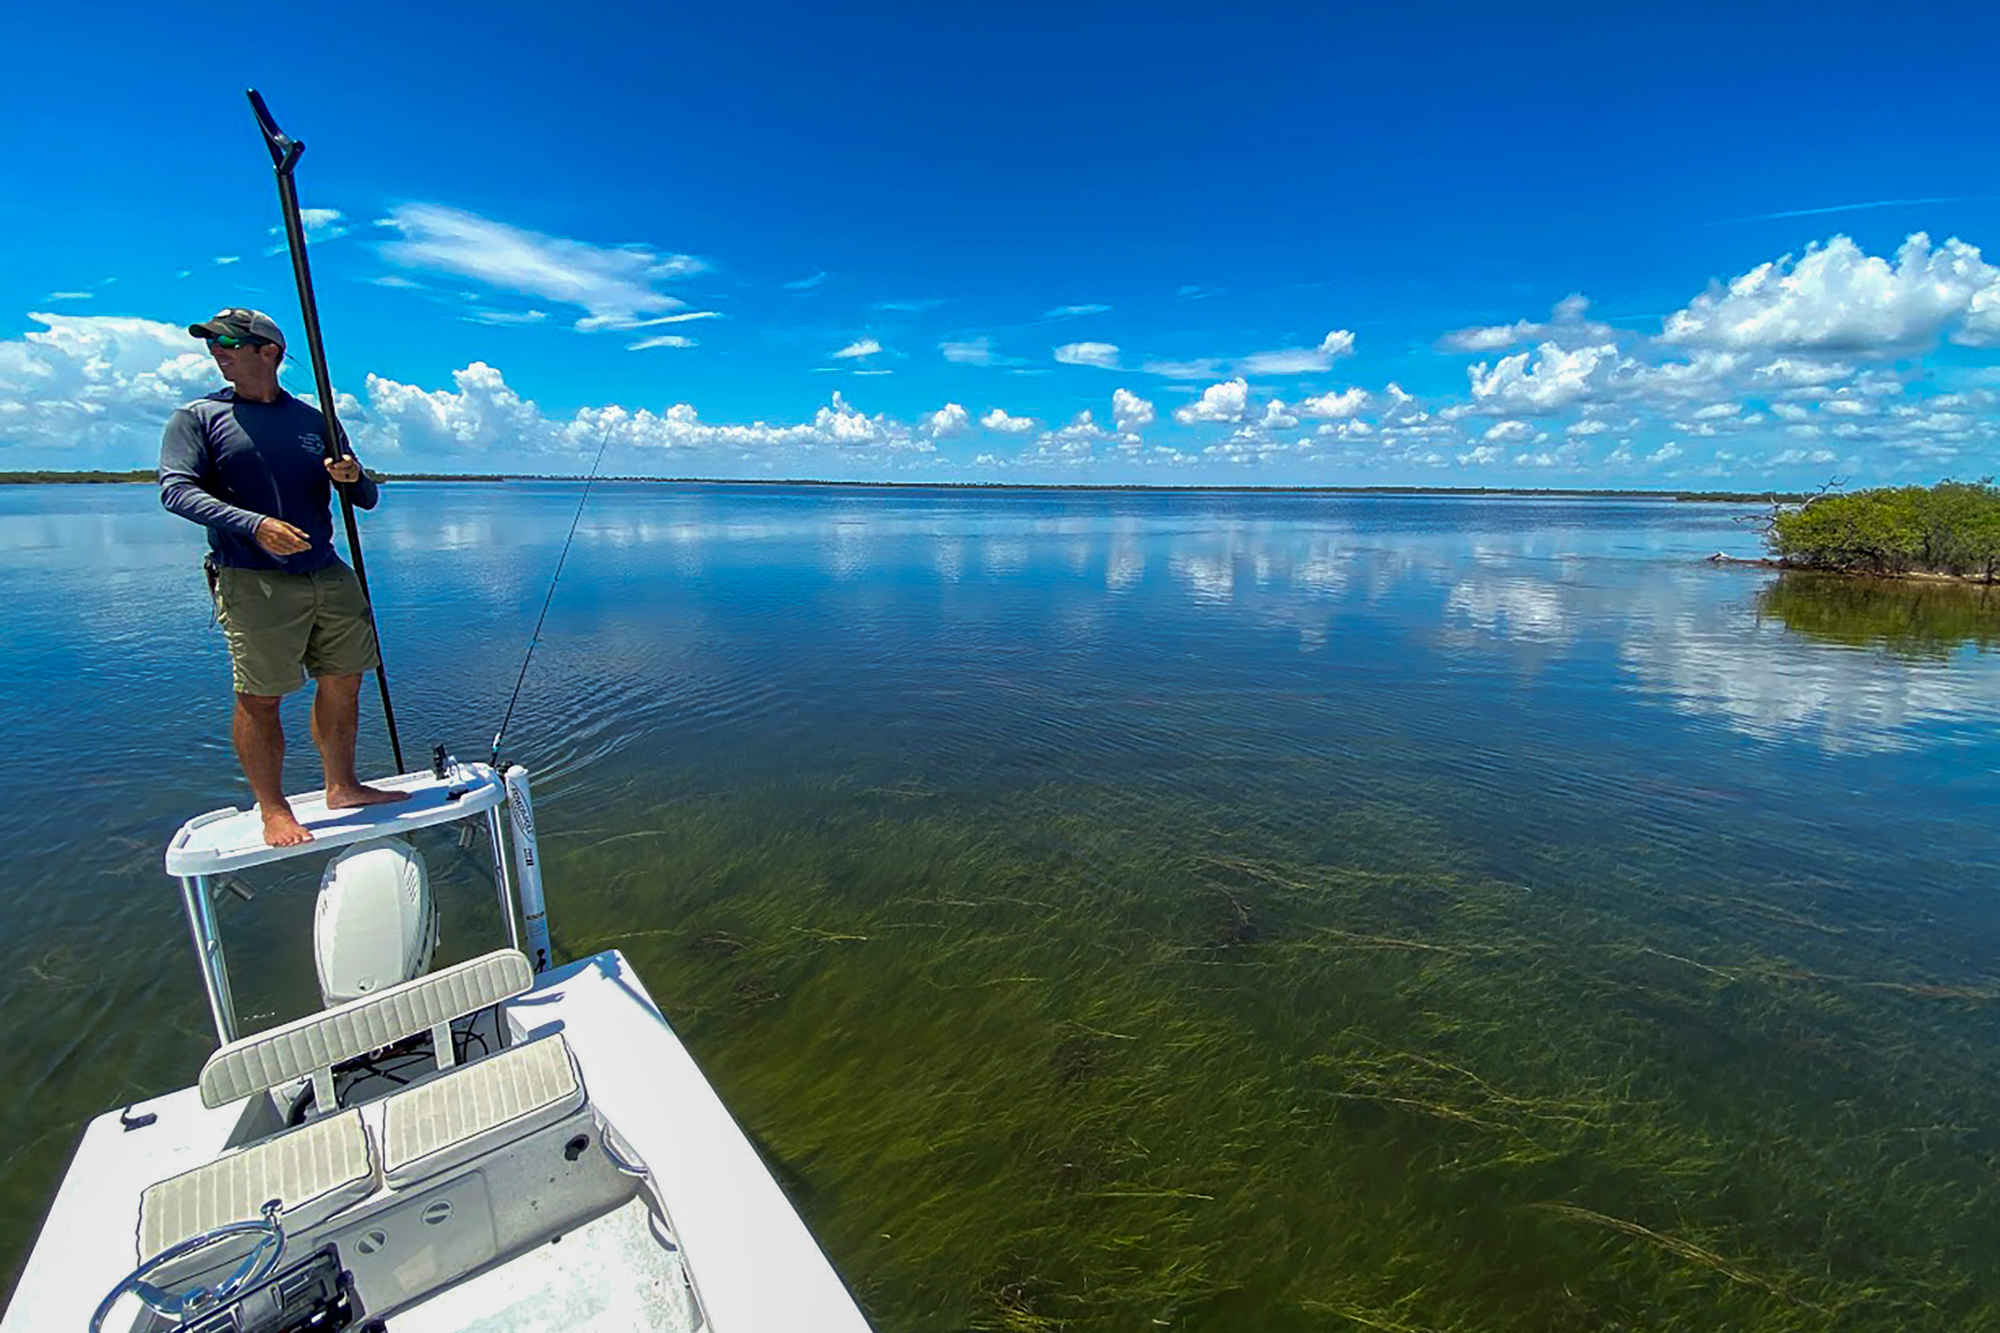
Seagrass in the Mosquito Lagoon and Northern IRL has grown substantially from its low point. Basin health across parts of the system has stopped falling. Manatees have been observed grazing again in some shallows. This is not a claim of lagoon-wide recovery — the lagoon remains fragile, still recovering, and still well below the seagrass acreage of the 1990s.
Photo: Lorae Simpson, Indian River Lagoon Council, via NOAA Fisheries. 2025 seagrass expansion data: Marine Resources Council 2025 Report and St. Johns River Water Management District.
The 2016 photo predates the SOIRL half-cent tax that voters approved later that same year. The 2025 photo comes after almost a decade of dedicated lagoon spending on septic conversions, muck dredging, wastewater upgrades, and stormwater projects. The recovery has multiple drivers — weather, statewide programs, federal partners, and long-running research all matter — and it is described by MRC and IRLNEP as measurable but fragile. The November 3 ballot asks whether the Brevard-specific portion of that dedicated funding continues.
A lot of the money in the SOIRL program does not go into the water at all. It goes into the pipes, drains, retention ponds, and wastewater plants that decide where rain ends up when it stops falling. If you have ever watched a storm come through Brevard and worried about your street, your yard, your neighbor's yard, or your seawall, the lagoon program is one of the things standing between you and worse.
A neighborhood that floods is a neighborhood whose home values drop, whose insurance premiums rise, and whose streets get worse every year. A lagoon program that funds stormwater and sewer infrastructure is one factor in protecting streets, driveways, and the ground people build on, alongside the many other flood-mitigation programs that operate independently of the lagoon tax.
Every project in this category is on the county's live project dashboard, sortable by category and neighborhood.
The Indian River Lagoon spans five counties on the water (Volusia, Brevard, Indian River, St. Lucie, Martin) and a seven-county watershed that adds Palm Beach and Osceola. Brevard County contains the largest single stretch of the lagoon shoreline and is the only Brevard-specific local funding source on the November 3 ballot. State, federal, regional, nonprofit, and research partners also contribute across the whole 156-mile system.
The lagoon system runs 156 miles tip-to-tip. Brevard County lines 72 miles of that shoreline — the largest single stretch of any county on the water. Every barrier island neighborhood, every causeway, and the launch corridor itself sit against it.
Sources: SJRWMD Fast Facts; IRL National Estuary Program.
The lagoon runs 156 miles tip-to-tip as the crow flies. But once you count every finger canal, every spoil island, every cove, every creek, every residential seawall, the actual water’s edge multiplies. A UCF field study documented 374 miles of shoreline just in the northern half from Ponce Inlet to Sebastian Inlet. Add the middle and southern segments and the real number pushes past 600 miles.
Sources: UCF STARS Shoreline Characterization (2016–2018); NOAA Fisheries.
The Indian River Lagoon is one of the most biodiverse estuaries in the Northern Hemisphere. Thousands of species of plants and animals live here — manatees, dolphins, sea turtles, redfish, snook, tarpon, mangroves, and seagrass. For a precise species inventory, see the science pages.
Sources: FAU Harbor Branch; Indian River Lagoon National Estuary Program (IRLNEP); NOAA Fisheries system-wide restoration overview.
Other partners contribute across the wider system. Brevard's funding mechanism is specific to the county's own stretch of shoreline.
Precise annual collection and share-of-budget figures require verification against the current official budget and are held pending v0.2B. Brevard County's adopted FY2025-26 budget document is the primary source to be verified against.
Brevard tourism generated economic impact reported by the Space Coast Office of Tourism. A precise scale comparison against the lagoon program is held pending verification rather than restated as an economic-return calculation.
This site does not present a household-cost figure, a leverage ratio, or a return-on-investment number for the renewal. Those calculations depend on the final verified ballot language and official fiscal figures, which are held per the v0.2A publication holds.
A common assumption is that if the ballot measure fails, voters simply get another chance the next year. Under Florida law, that is not automatically how this works.
Florida Statute §212.055(10):
“A referendum to reenact an expiring surtax must be held at a general election occurring within the 48-month period immediately preceding the effective date of the reenacted surtax. Such a referendum may appear on the ballot only once within the 48-month period.”
Source: Florida Statutes, Chapter 212.055 — Discretionary Sales Surtaxes.
In plain English: if the November 3, 2026 renewal fails, Brevard County cannot put the same lagoon-tax reenactment question back on the ballot until the next general election within the 48-month window that follows. The exact resulting gap in local dedicated funding depends on the current tax's expiration date and is held pending verification of the final official ballot language (see Ballot at a glance above).
Set the statutory clock aside for a moment. The physical work of lagoon restoration — septic-to-sewer conversion, wastewater plant construction, muck dredging, stormwater retrofit — follows the same kind of engineering and permitting timeline as other large civil infrastructure.
Every project needs state DEP, water management district, Army Corps of Engineers, and often federal environmental reviews before a shovel moves.
Draft the RFP. Advertise. Collect bids. Evaluate. Negotiate scope. Award. Contract. Only then does construction start.
If funding lapses mid-stream, contractors may redeploy crews to other jobs, bids can expire, and prices can reset.
Environmental review windows close. Design drawings can age out of code compliance. Restarting can mean redoing much of the work from square one.
The statutory and engineering timing above both point in the same direction: renewal and non-renewal are not symmetric options with an easy do-over.
Florida is one of the biggest tourism economies in the country. Cocoa Beach alone hosts a large annual visitor population against a much smaller resident population. Every visitor — every rental car, every hotel stay, every gas fill-up, every dinner, every souvenir — pays the same half-cent sales tax residents do.
Because this is a sales tax, visitors contribute automatically alongside residents every time they make a taxable purchase in Brevard. Specific dollar and percentage estimates are held pending verification per the v0.2A publication holds.
Here is the math on what households already pay for this program — and estimated categories of value it may help protect for a house, a neighborhood, and the water. Household-value estimates below are illustrative modeling, not verified official figures; treat the multiplier and dollar outputs as estimates pending further review.
Data date: All figures below reflect data current as of 2026-07-26. Regenerate the model when Balmoral, Brevard County, or Florida Department of Revenue publish updates.
Tax-cost side (input A): The user enters annual household taxable spending in Brevard. The tool applies the half-cent SOIRL sales-tax rate (0.005) directly to that number. Groceries and prescription medicines are exempt under Florida law and should be excluded from the spending input. Source: Florida Department of Revenue — Sales and Use Tax. This side is a straight arithmetic calculation and does not depend on any modeling.
Value-protected side (input B): The tool models three categories of value the lagoon may help protect for a household:
Ratio (“24×”): This is the modeled sum of the value-protected side divided by the tax-cost side, at the current input values. It is an estimate and not a verified return-on-investment figure. The Balmoral 2025 report itself reports approximately $24 in benefits per dollar invested for the nine selected NOAA-funded restoration projects examined in that analysis; the tool's ratio is derived on the same modeling family, not measured across every SOIRL project. Every SOIRL dollar and every lagoon project is different; do not read this as a program-wide measured return.
Known limitations:
Peer review status: The Balmoral Group 2025 study is a commissioned technical valuation for IRLNEP, not a peer-reviewed academic paper. Treat its figures as authoritative for its analytical scope and cite them explicitly where used.
This is a sales tax — charged on what you buy in Brevard, not where you live. Half a cent on each dollar of taxable spending. Visitor share of collections will be added when the current figure is independently verified.
This is a modeled estimate, not a verified figure, based on the Balmoral Group 2025 hedonic analysis. Treat this and the multiplier below as illustrative, not a guarantee.
Tax math: half-cent sales tax rate applied to household taxable spending (Florida Dept. of Revenue). Home premium and ecosystem value math from Balmoral Group 2025 IRL Economic Valuation. These are modeled estimates for illustration; actual value depends on your specific home, location, and spending, and household-cost/return figures remain subject to the v0.2A publication holds.
The sections above are the short version. Deeper pages cover the science, the money, the projects, the critiques, and how to vote.
What nitrogen and phosphorus actually are, why the lagoon is dying of fertilizer, and why every project is measured in pounds removed per year.
Read → 02Ways the lagoon connects to home value, fishing, water quality, and flood risk — with sourcing and limitations noted.
Read → 03How SOIRL funds have been allocated across septic upgrades, muck removal, stormwater, and habitat work. Live receipts.
Read → 04Standout completed projects — Grand Canal muck dredging, Crane Creek M1, Rockledge WWTP, Ray Bullard stormwater, and more.
Read → 05The hardest questions about the tax — audit, reserves, project selection — answered honestly.
Read → 06Registration, early voting Oct 19–31, and Election Day Nov 3. Precinct lookup included.
Voting logistics →